Understanding the System Notes and Sequence of Events
The System Notes section of the Alert Software provides a play-by-play look at everything that transpires each market session. Each “event” hits the system notes in real-time. The System Notes is an integral part of the software since it keeps you sequentially updated to everything that occurs in the system each day.
Most of what you see in the System Notes is self-explanatory, but it’s important to understand how the “sequence of events” works.
This page will help you understand each “event” that you might see in any given session. I picked this day to use as an example because every potential event that you might see on any given market day occurred. Each day is unique and things will play out differently, but this is an ideal example to help you understand how everything works.
Example of A Full Market Session From Beginning to End
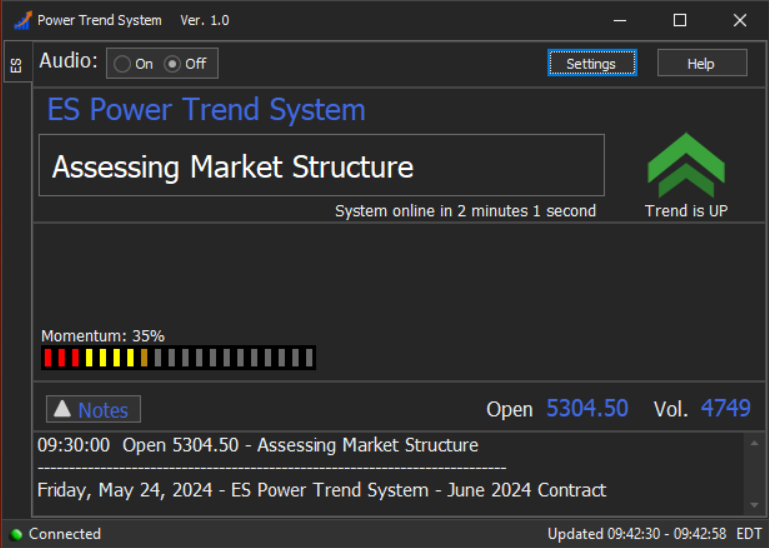
At 9:30 ET as soon as the market cash session “opens” the opening price is posted, and the Alert software will go into a period of limited functionality for the next 15 minutes with a note “assessing market structure” until 9:45 ET. No entries are allowed during this period, but the open, volume, trend direction, and momentum will be displayed. (image below)
———————————————————
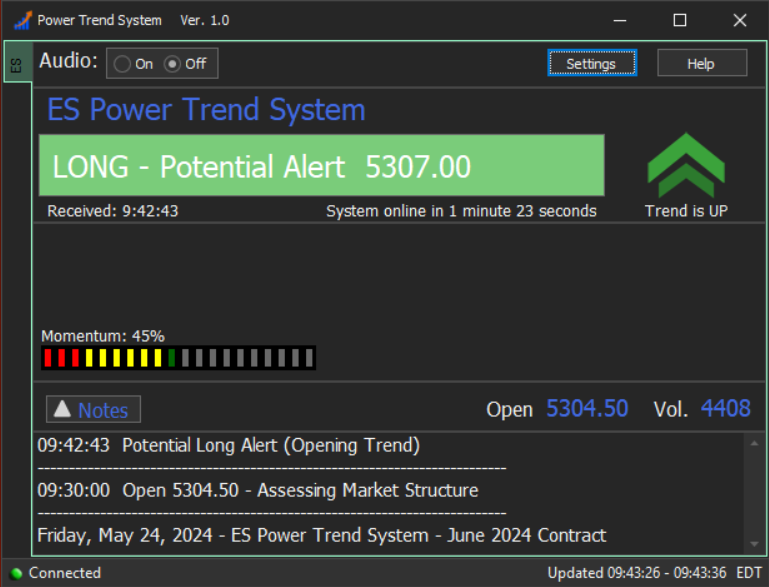
At 9:42 just a few minutes prior to the system coming online, it displays a heads-up that a “potential” Opening Trend Continuation Long Alert might be on deck. Remember a Potential Alert is just a heads-up. Potential Alerts come and go frequently without making it to the “get ready to take a trade” stage. (image below) Focus on the System Notes in each of the screenshots below and note the “sequence of events” as the session plays out.
———————————————————
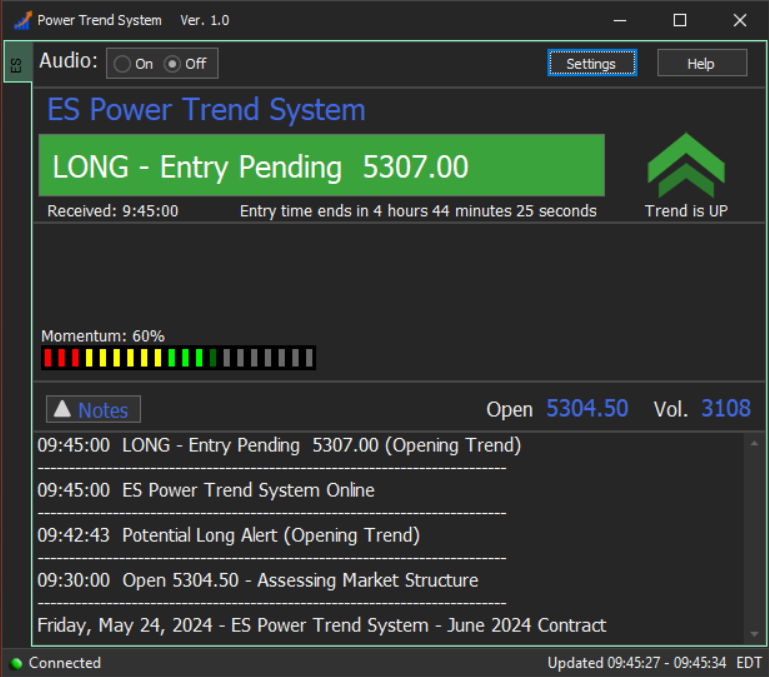
At 9:45 when the system officially came online, you can see in the System Notes below that the Potential Long Alert above turned into a “Long Entry Pending” Alert. The Note indicates that it’s an “Opening Trend Continuation” Alert, which will not appear every session. The Opening Trend Continuation Alerts only appear on days when the pre-market price action and subsequent early cash session trading confirms that a primary trend is already underway – and we might want to hop on that trend. (shown below).
———————————————————
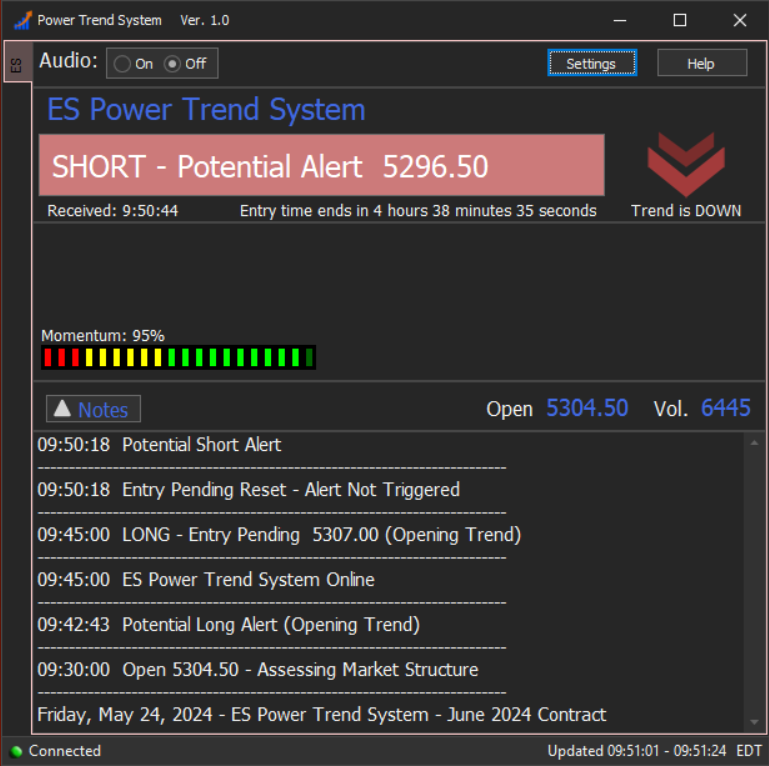
The Long – Entry Pending Alert above did not “trigger-in”. The price reversed quickly and you can see the line in the System Notes that says “Entry Pending Reset – Alert Not Triggered” below. Anytime there is an Entry Pending that does not “fill” you will see the Entry Pending Reset – Alert Not Triggered message appear. This means you can take your hand off the mouse for now, the price action did not meet the criteria to actually trigger-in or “confirm” the entry.
At the same time, as we see in the image below, the system indicated a “Potential Short” might be setting up.
———————————————————
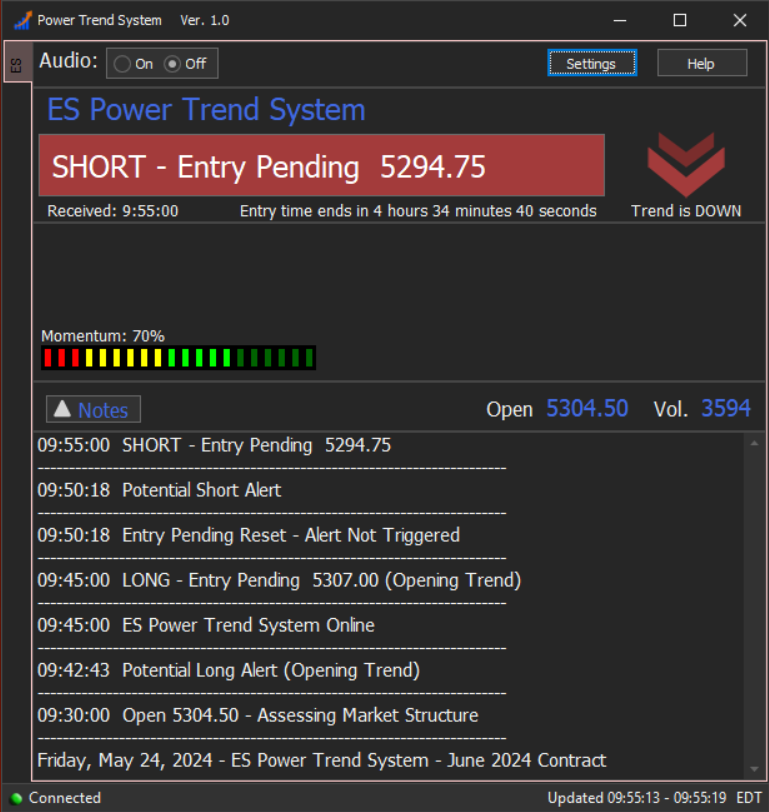
At 9:55 the prior Potential Short Alert above became an official “Short – Entry Pending” at 5294.75. This means “get ready to take a trade”. The very next 1-minute price bar that CLOSES at 5294.50 or lower will officially trigger-in a trade. It’s important to understand that an Entry Pending Alert is the actual trade alert with the actual “price to beat” trade barrier.
———————————————————
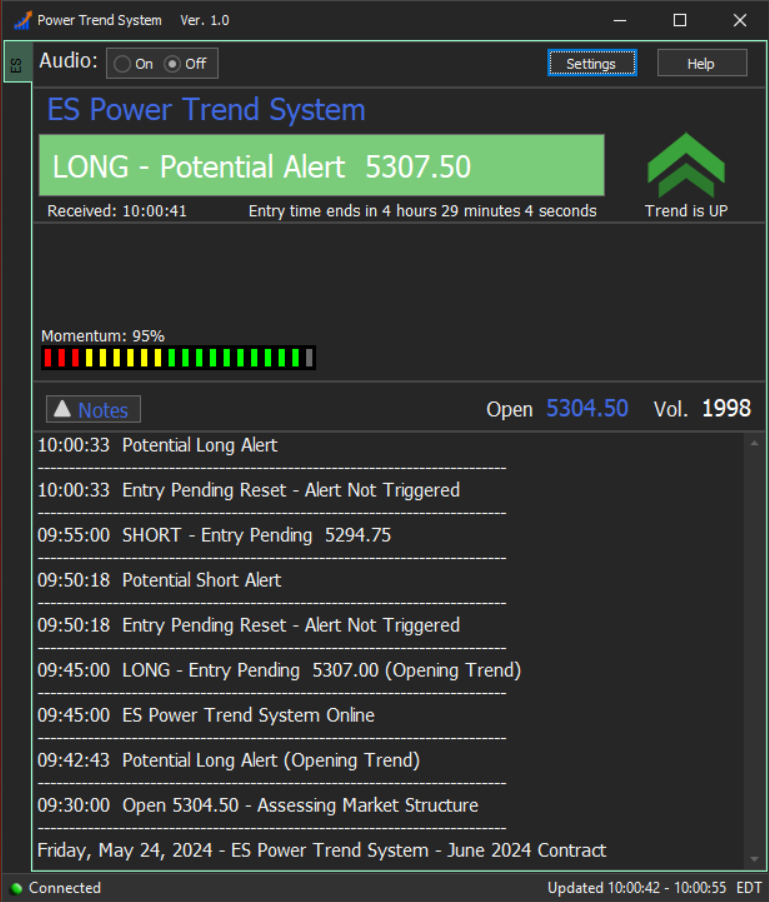
As we see below, the prior Short Alert didn’t trigger and the Alert switched back to a Potential (heads-up) Long. It’s not uncommon to see a series of Potential Alerts flip back and forth from Short to Long on certain days in early trading as the price action unfolds – and price is attempting to pick a direction. The key is that the software will attempt to “verify” a primary trend is beginning before we will actually get triggered into a trade.
Note that you won’t necessarily see the alerts “flip” from Long to Short and back this frequently or quickly. The example session on this page is designed to show all the different potential scenarios that might occur. There will be frequent Potential alerts that don’t get to the Pending stage or Pending alerts that don’t trigger-in, but flipping Long to Short like this means the market is whipsawing around prior to an actual trend being established.
———————————————————
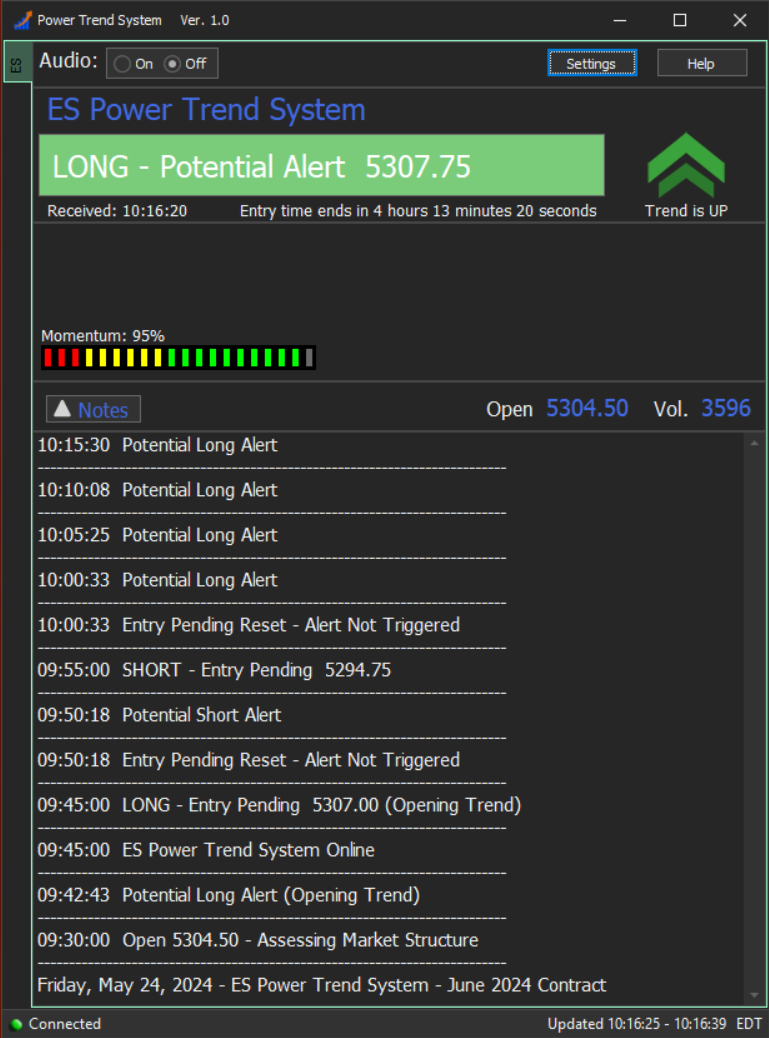
This next screenshot below is an example of how you might see a series of Potential Alerts, which are simply indicating that the trend direction is in the midst of shifting and that a trade might be coming up. Sometimes there will only be one Potential Alert before it turns into an Entry Pending Alert – and other times you might get something like this where the system is determining the viability of the trend and displays a series of Potentials. The fact that we see 4 Long Potential Alerts in a row indicates that a significant “primary trend” is likely developing.
———————————————————
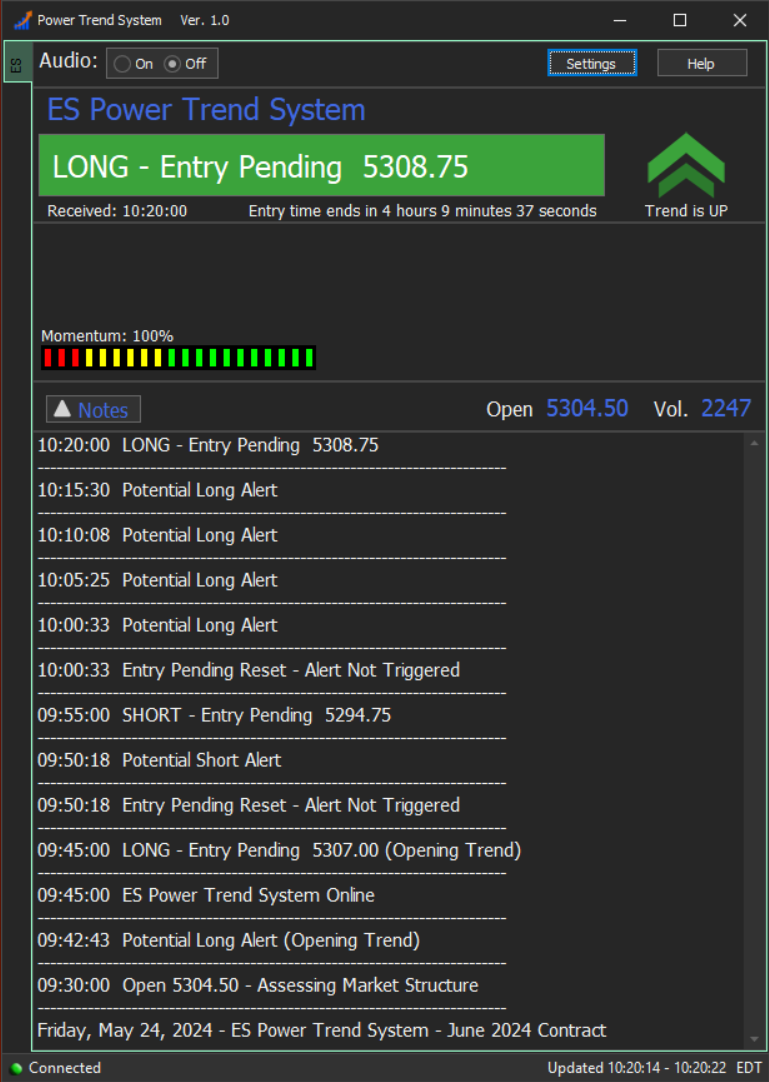
Now at 10:20 the series of Potential Alerts has officially turned into a Long – Entry Pending Alert, which means the very next 1-minute price bar that closes at least a tick or more PAST the Alert price 5308.75 will trigger-in the trade. (Note the “Received: 10:20 time stamp in the upper left section of the software just under the Alert Banner). Entry Pending = Get Ready to Take a Trade.
———————————————————
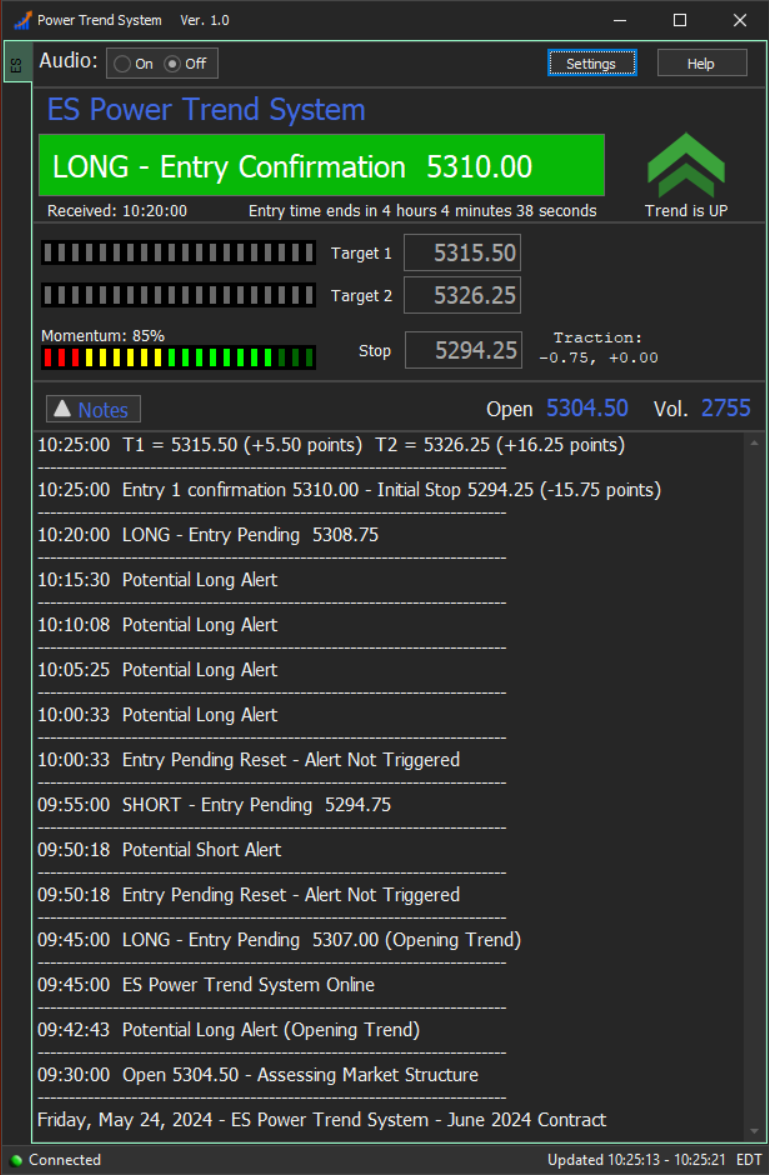
Below we see the Long Alert has triggered-in. The Entry Confirmation Alert Banner means the trade is filled. The Pending Alert above was triggered-in because there was a “1-minute price bar CLOSE PAST the Pending Entry price. The “fill” or Entry Confirmation here was 5310.00 which was 1.25 points past the Pending Price from the screen above. The System Notes show the Entry Confirmation happened at exactly 10:25 and the software now displays the Initial Stop and the Targets in the upper section of the software.
———————————————————
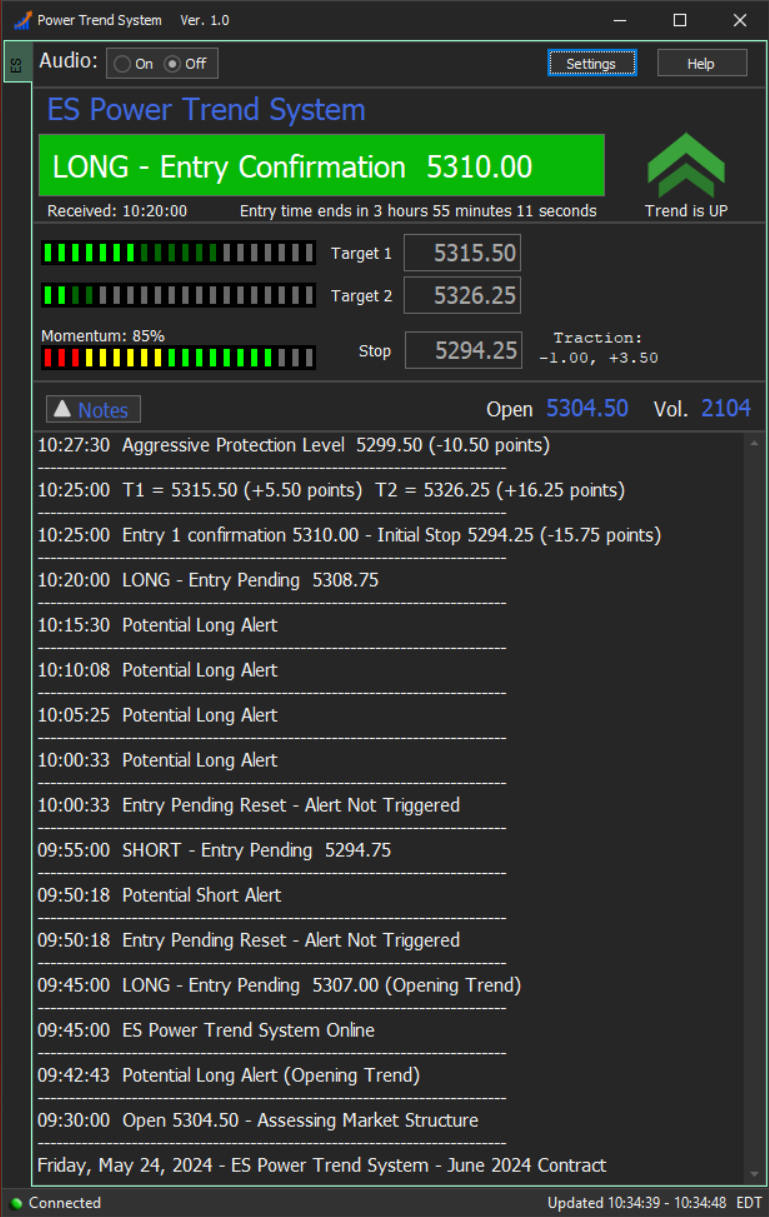
Below we see that the price made a move close to Target 1 and the Aggressive Protection Level Trailing Stop move has kicked-in. This means that you have the option of discretionarily using the APL as a tighter stop than the Initial Stop – but the system will keep the trade open even if the Aggressive Protection Level gets hit. Only the Initial Stop will close the trade prior to Target 1 getting hit.
———————————————————
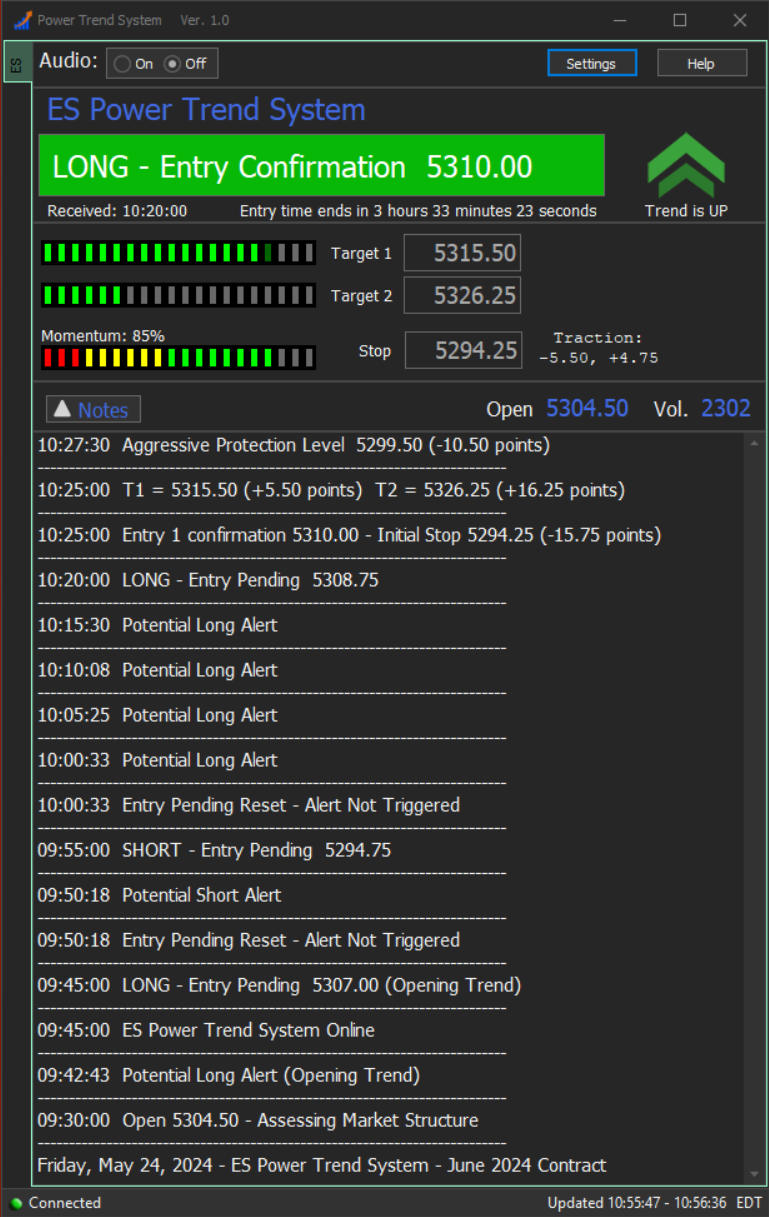
This is the same screenshot as above, but notice how in the upper section of the software we can see the Progress Meters are displaying the progress towards the Targets. Price is getting pretty close to Target 1.
———————————————————
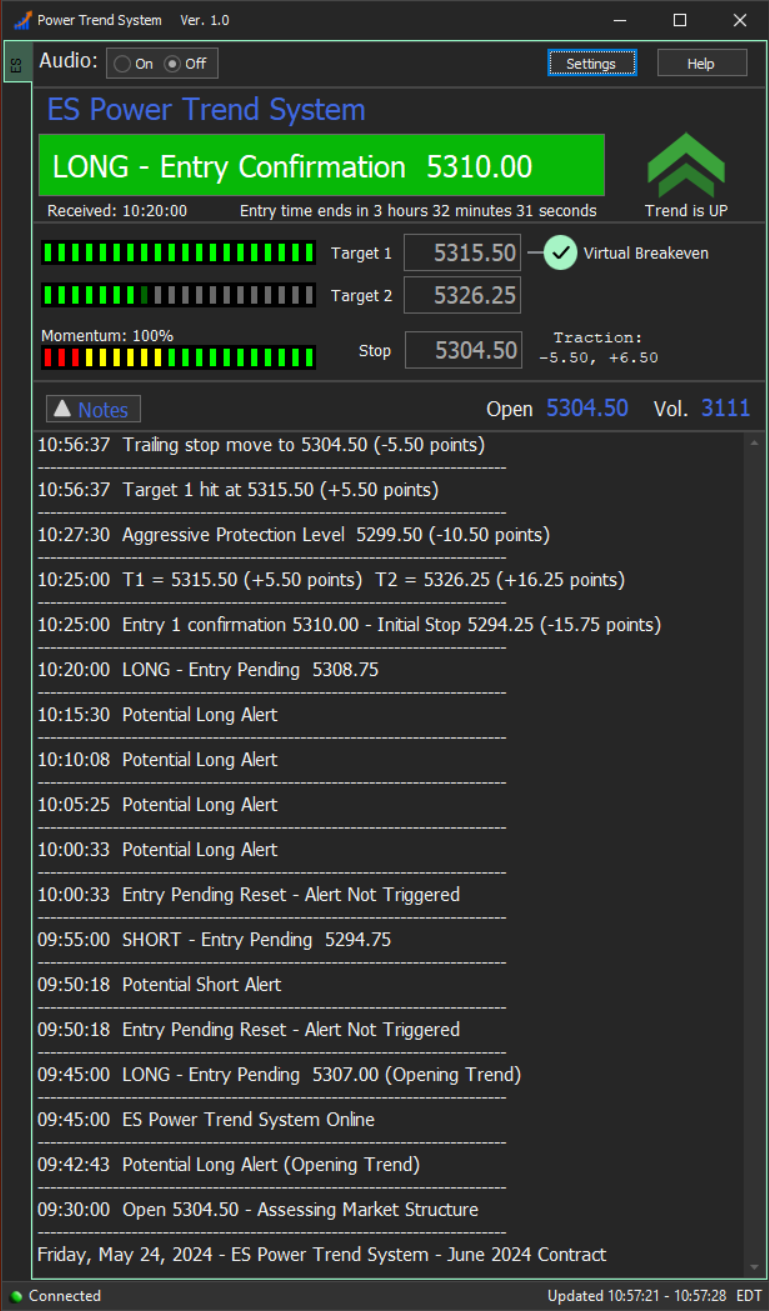
At 10:56 Target 1 got hit and the trade is now at “Virtual Breakeven”. This means that on a 2 Contract trade, we sold one contract and took profits at Target 1 +5.50 points, and now the Trailing Stop has ratcheted to -5.5 points below the Entry. At this point even if price makes no further progress and reverses to hit the Trailing Stop, the trade would be a “breakeven”. NOTE: Trading 3 Contracts and selling 2 at Target 1 means the trade will always score the T1 points, in this case +5.50, even if the “ratcheted” stop gets hit.
———————————————————
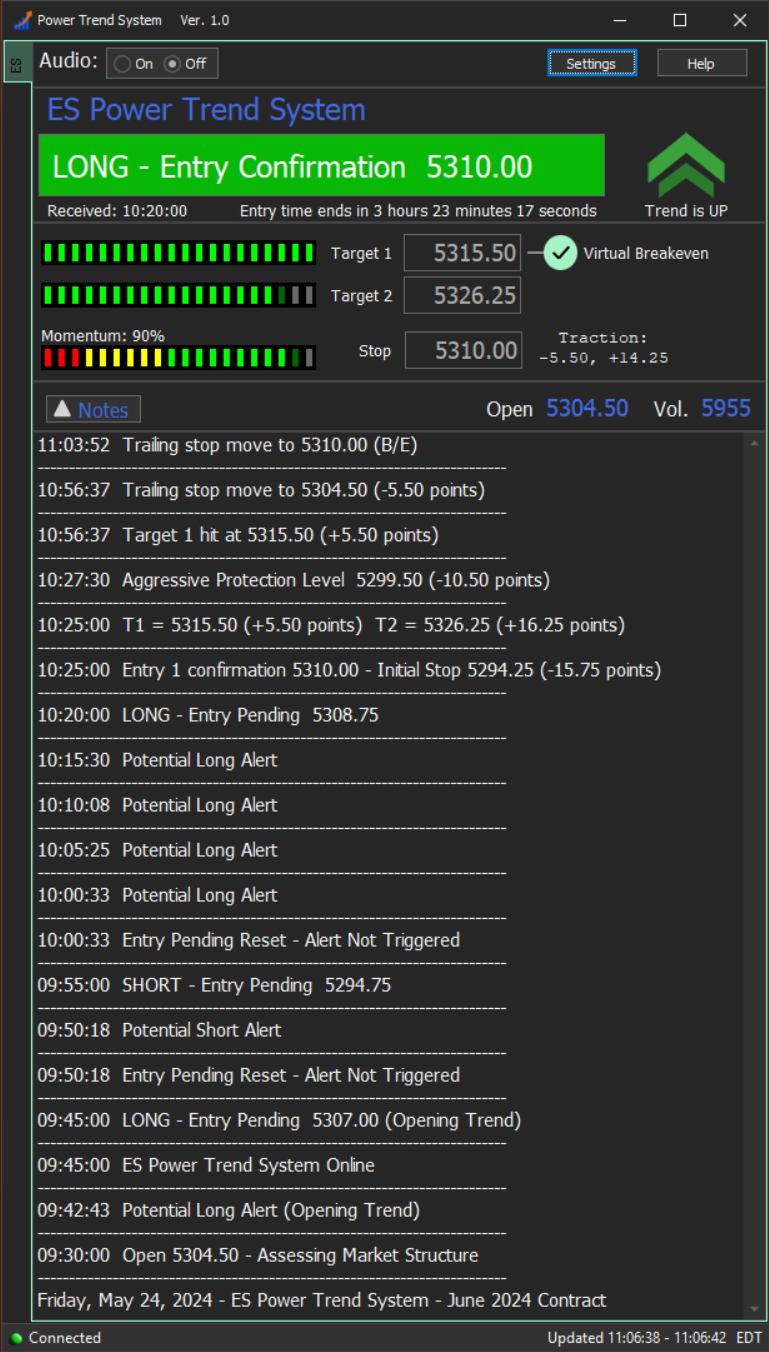
Below we see that the price is approaching Target 2 and the Trailing Stop has ratcheted again – this time to the actual Entry at 5310.00. The (B/E) next to the Trailing Stop move indicates that the 2nd Contract is at breakeven now too – since the Stop is at the exact same level as the Entry. Notice the Traction display in the top section next to the Stop is keeping score on how much “heat” we took on this trade (-5.50 points) and the maximum “move in our favor so far” (+14.25 points).
———————————————————
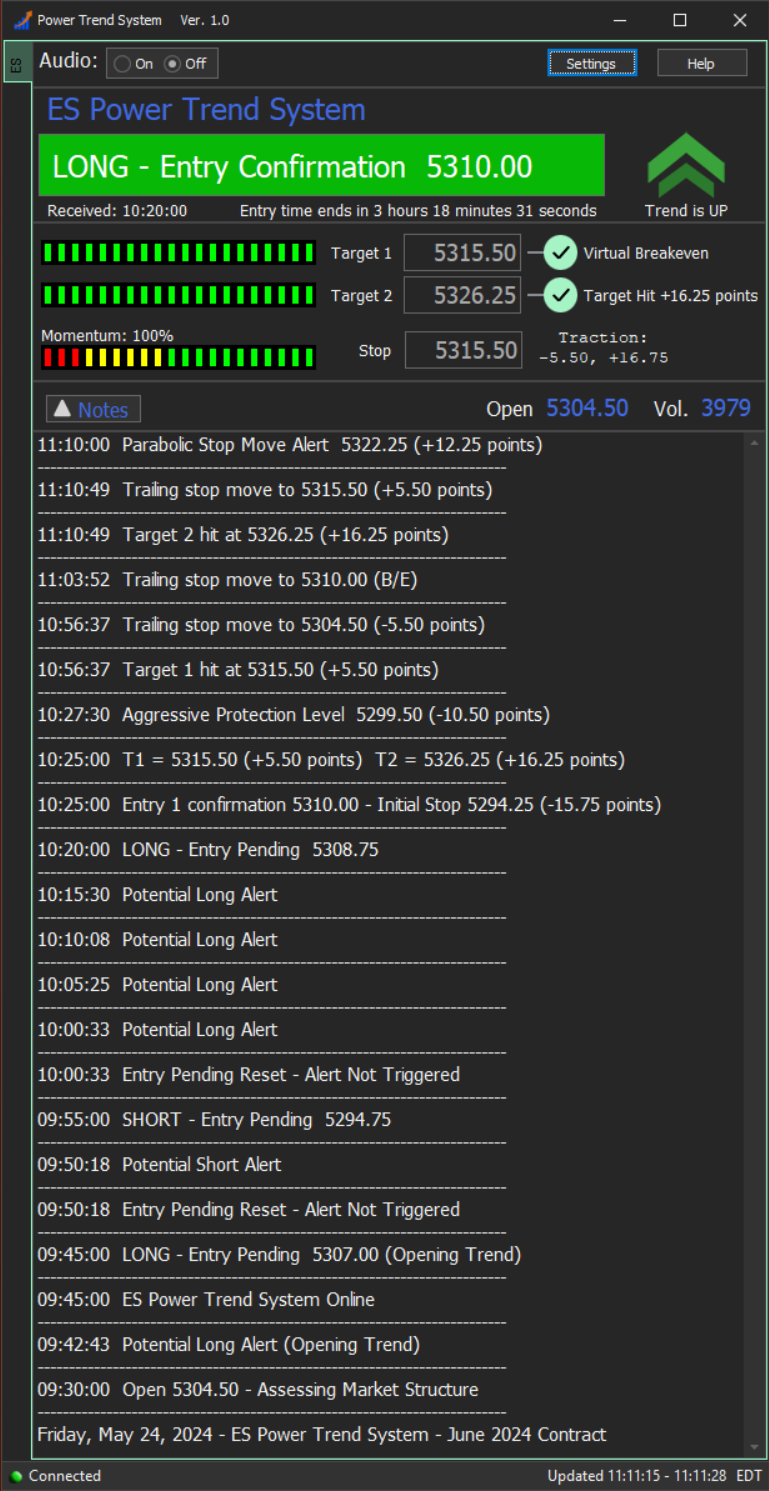
Target 2 is now hit and you can see the green check mark to the right of T2 indicating the system captured a +16.25 point move from the Entry to Target 2. If you were trading 2 contracts and shooting for both targets, you sold one at T1 for +5.50 points and one at T2 for +16.25 points for a total of +21.50 points and are “done for the day”. The system remains active and will continue to move the trailing stop after Target 2 gets hit. Price continues to “ride the trend” higher and users with additional contracts may still be holding past T2 for “runners” (using the system stop).
———————————————————
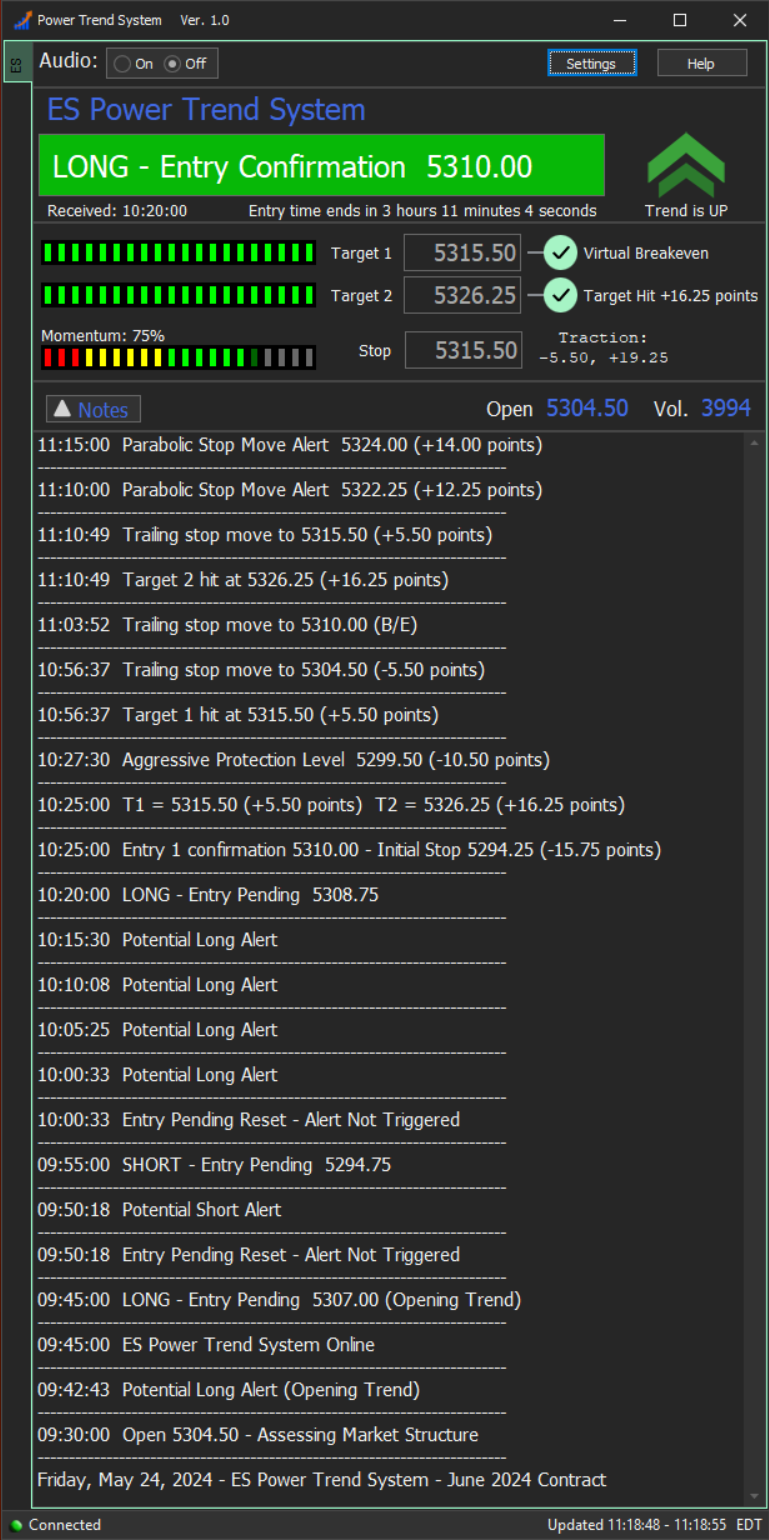
The Parabolic Stop Moves (below) are kicking in as price has surged to unsustainable levels and is extremely extended. The Parabolic Stops are optional “discretionary” levels where you can choose to sell some or all remaining contracts past Target 2. When price hits a Parabolic Stop, it does not close the trade as there is still potential for the trend to continue. The Parabolic Stop gives you the option to lock-in maximum gains when the price gets overextended in the near-term. Parabolic Stop moves appear fairly infrequently and only display when price makes a dramatic move in a short amount of time. The +14.00 points to the right of the most recent Parabolic Stop Move indicates that Pstop is 14 points above the Entry. This is useful when trading multiple Contracts so you can choose to lock-in max gains on some of the contracts and still hold others for “runners” should the trend continuation persist.
———————————————————
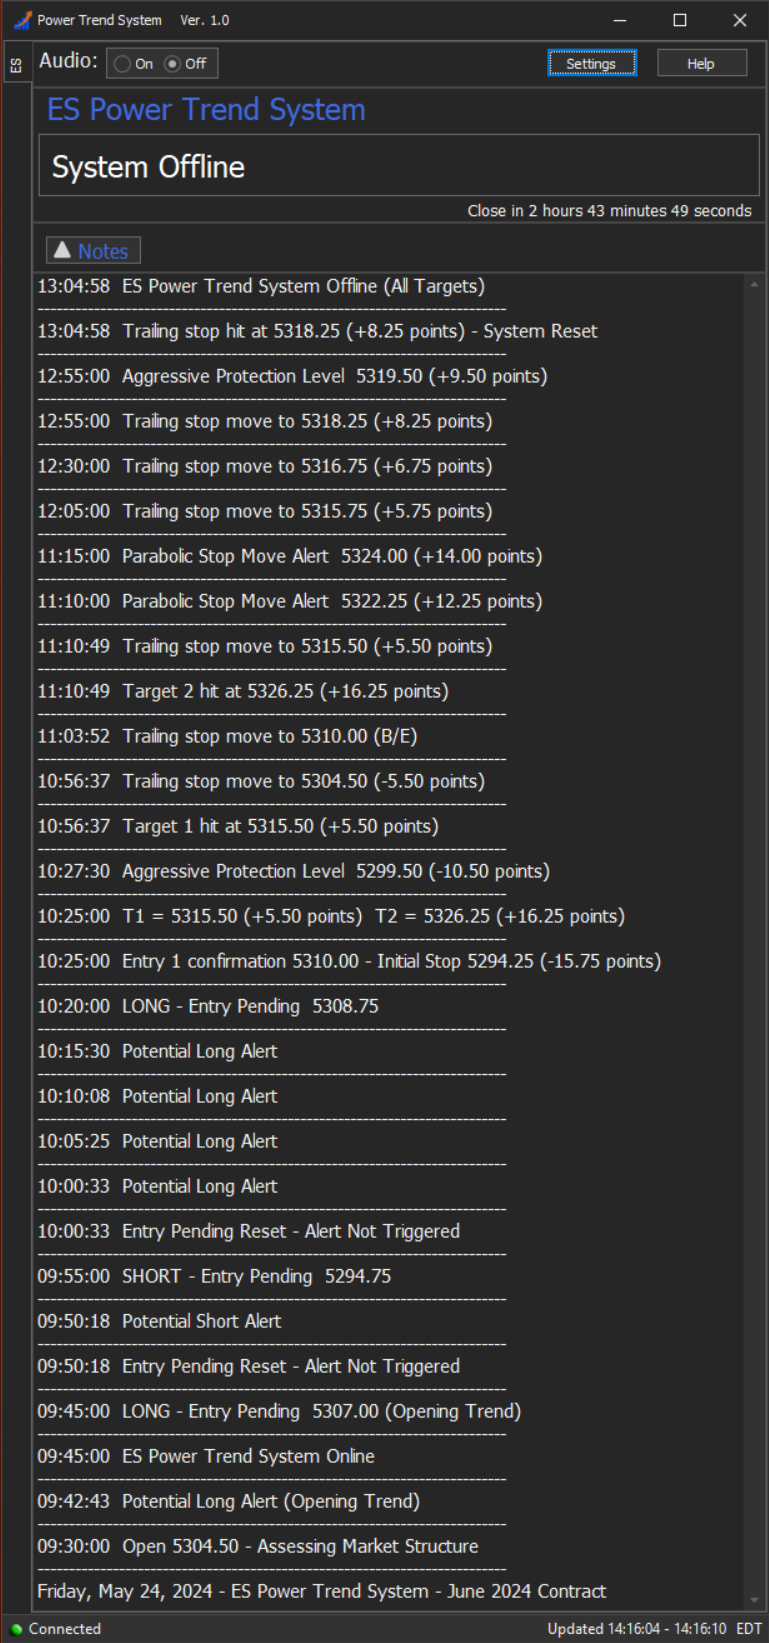
This final screenshot shows that the Trailing Stop ratcheted a few more times and finally got hit at 5318.25 which was +8.25 points over the Entry. This is in addition to the gains captured at the 2 Targets. Also notice another “optional” Aggressive Protection Level appeared which is a discretionary “tighter stop” you can use if you wish. Once both Targets get hit and the price eventually hits the Trailing Stop, the system goes offline for the rest of the session. It’s considered a “big win” and there’s no reason to stick around and press our luck by attempting to take another trade.
———————————————————
Summary:
The “play-by-play” above shows the activity in a fairly unusual market session. Before the primary trend was established there was a lot of back and forth potential alerts and pending alerts that didn’t trigger-in. Normally you won’t see this much activity, but it’s useful for understanding how things might play out in some sessions when the price action is erratic in early trading.
In addition to that, every possible type of “event” occurred this session. It’s a lot to take in but once you spend a few days observing the software in action, you’ll realize it’s quite simple. The System Notes provide a real-time sequential record of everything that transpires in the software over a market session. The System Notes remain in the software until Midnight eastern time. If you miss a session you can always refer to the notes later in the day or evening to see how things played out that day.